2026 Iran War — Atmospheric Impact Study
Hamza Zeewaqar · 2026
Satellite-derived atmospheric records and ground-truth meteorological data across 7 nations quantify the environmental footprint of the 2026 Iran conflict — from aerosol shifts to statistically significant temperature anomalies in countries hundreds of kilometres from the front lines.
Study Design
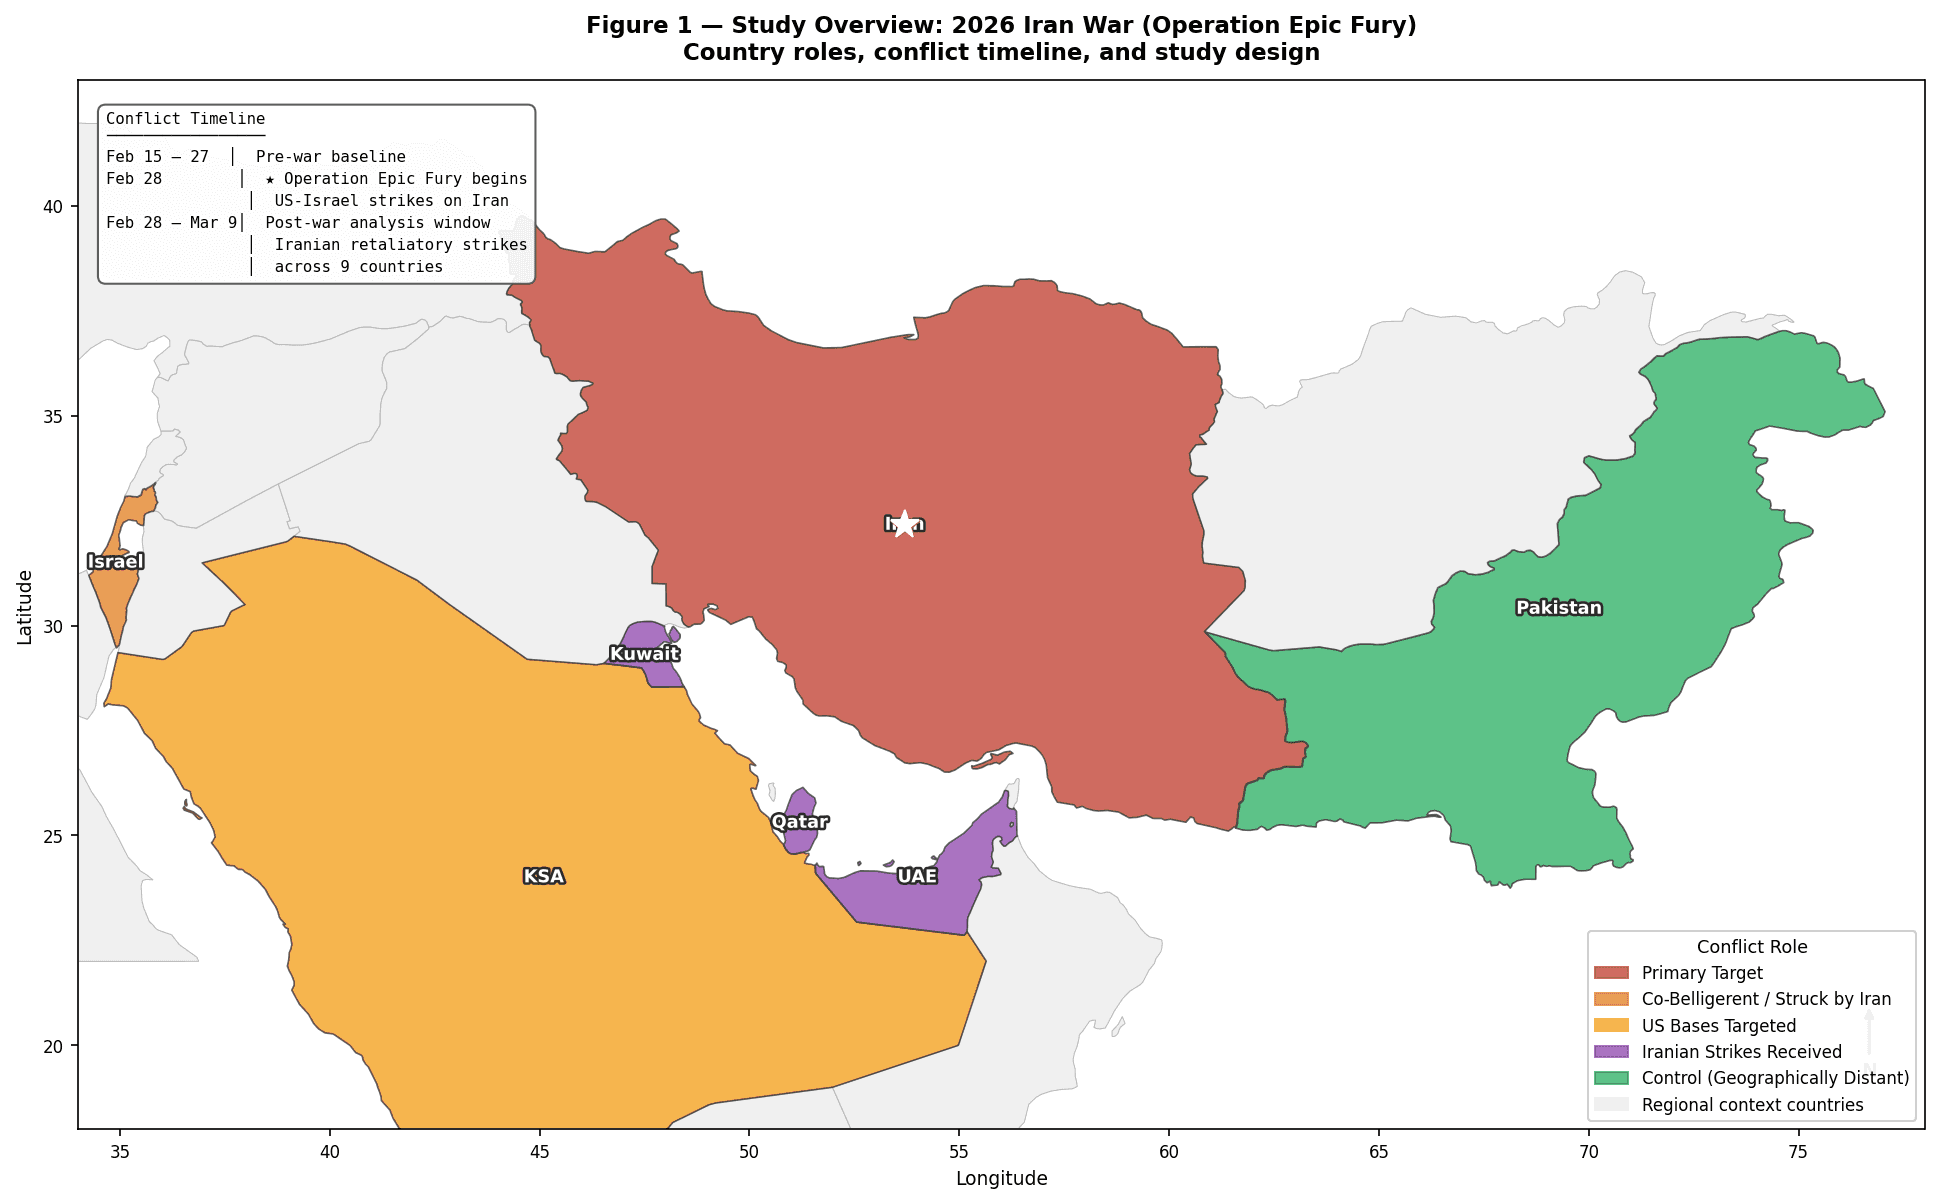
Seven countries were assigned conflict roles against a defined timeline: Iran (primary target), Israel (co-belligerent), Saudi Arabia / Kuwait / Qatar / UAE (US-base and strike zones), and Pakistan as a geographically distant control. Daily values for 22 atmospheric and meteorological variables were pulled from NASA Giovanni (AOD, NO₂, SO₂, CO, methane, ozone) and NASA POWER (temperature, humidity, wind speed/direction), then compared against a 5-year day-of-year baseline (2021–2025).
Methodology
- 01Build per-country day-of-year baseline from 5 years of NASA archive data
- 02Collect 2026 war-period observations (Feb 15 – Mar 9)
- 03Split into pre-war (Feb 15–27) and post-war (Feb 28–Mar 9) windows
- 04Z-score each daily value against its baseline mean and standard deviation
- 05Run Welch's t-test and compute Cohen's d effect size per country × variable
- 06Classify results by statistical significance, effect magnitude, and expected conflict direction
Tech Stack
| Layer | Tools |
|---|---|
| Data Collection | NASA Giovanni API · NASA POWER API · custom CSV parsers |
| Processing | Python · pandas · NumPy · SciPy (ttest_ind, stats) |
| Statistics | Welch's t-test · Cohen's d · Z-score anomaly detection |
| Visualisation | Matplotlib · openpyxl (formatted Excel reports) |
| Output | Automated CSV results · multi-sheet Excel workbook · 100+ PNG figures |
Spatial Overview
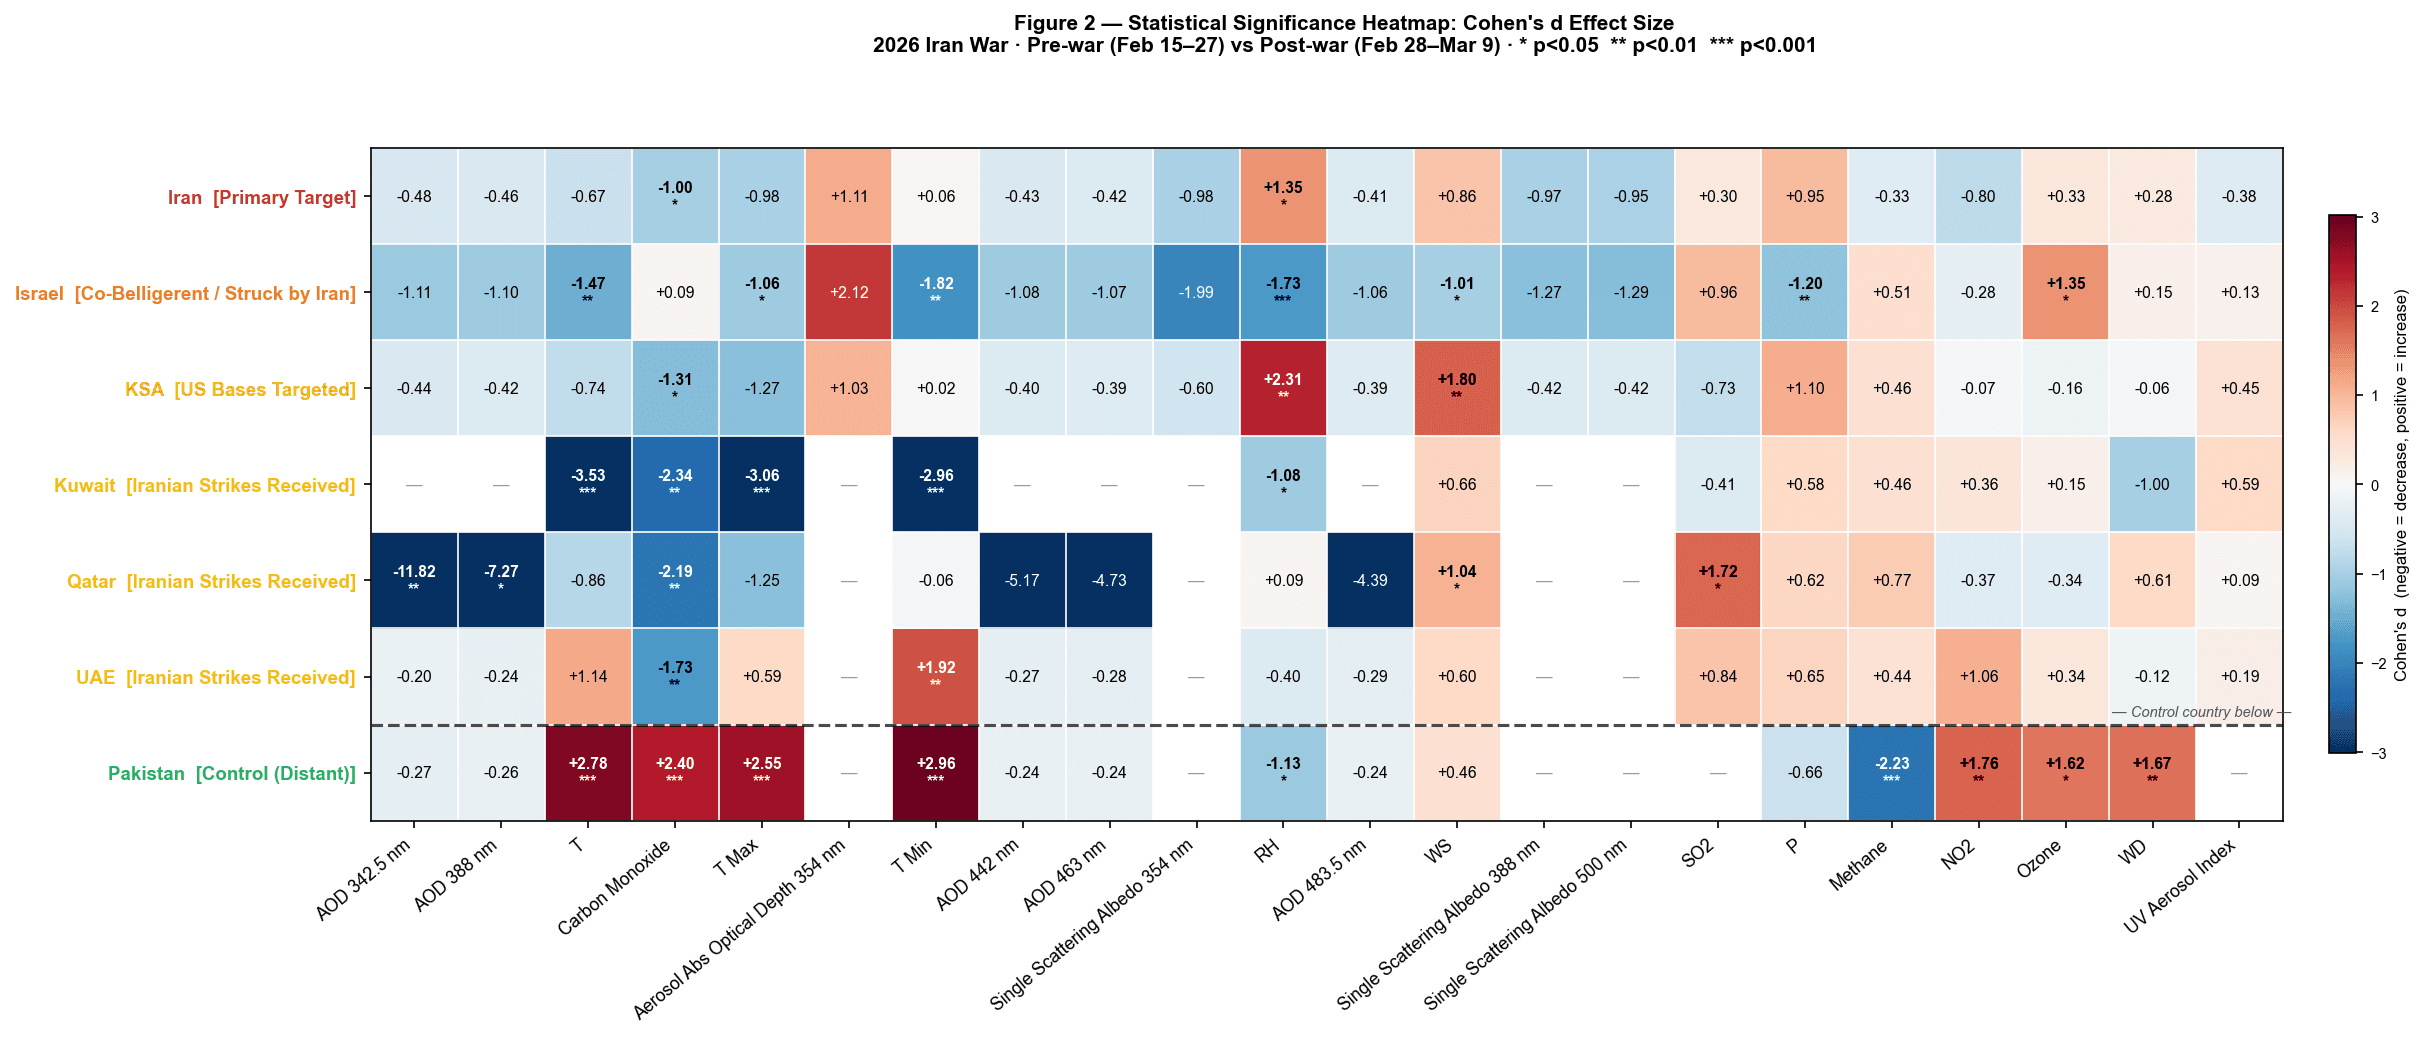
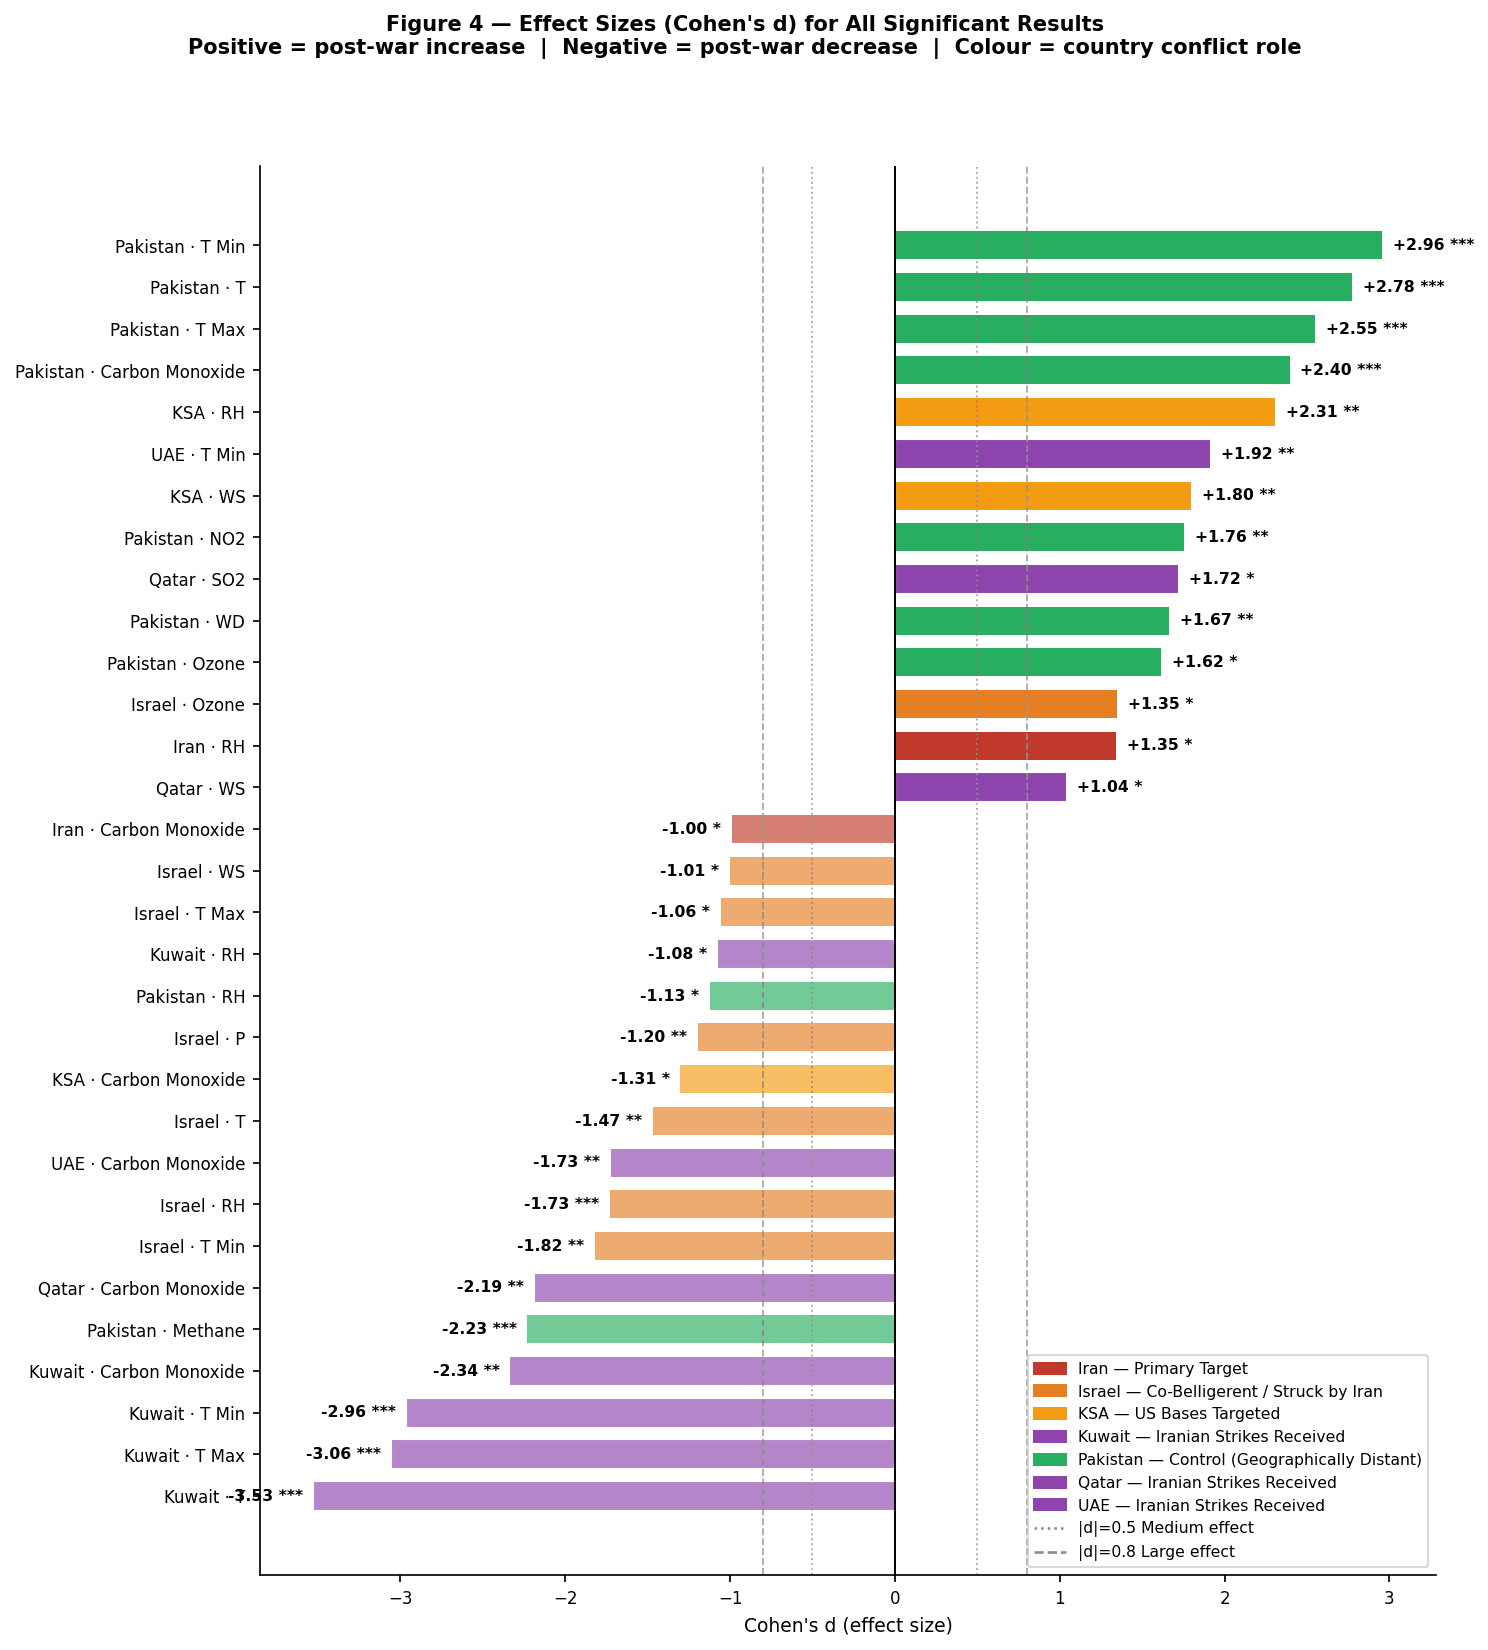
Key Findings
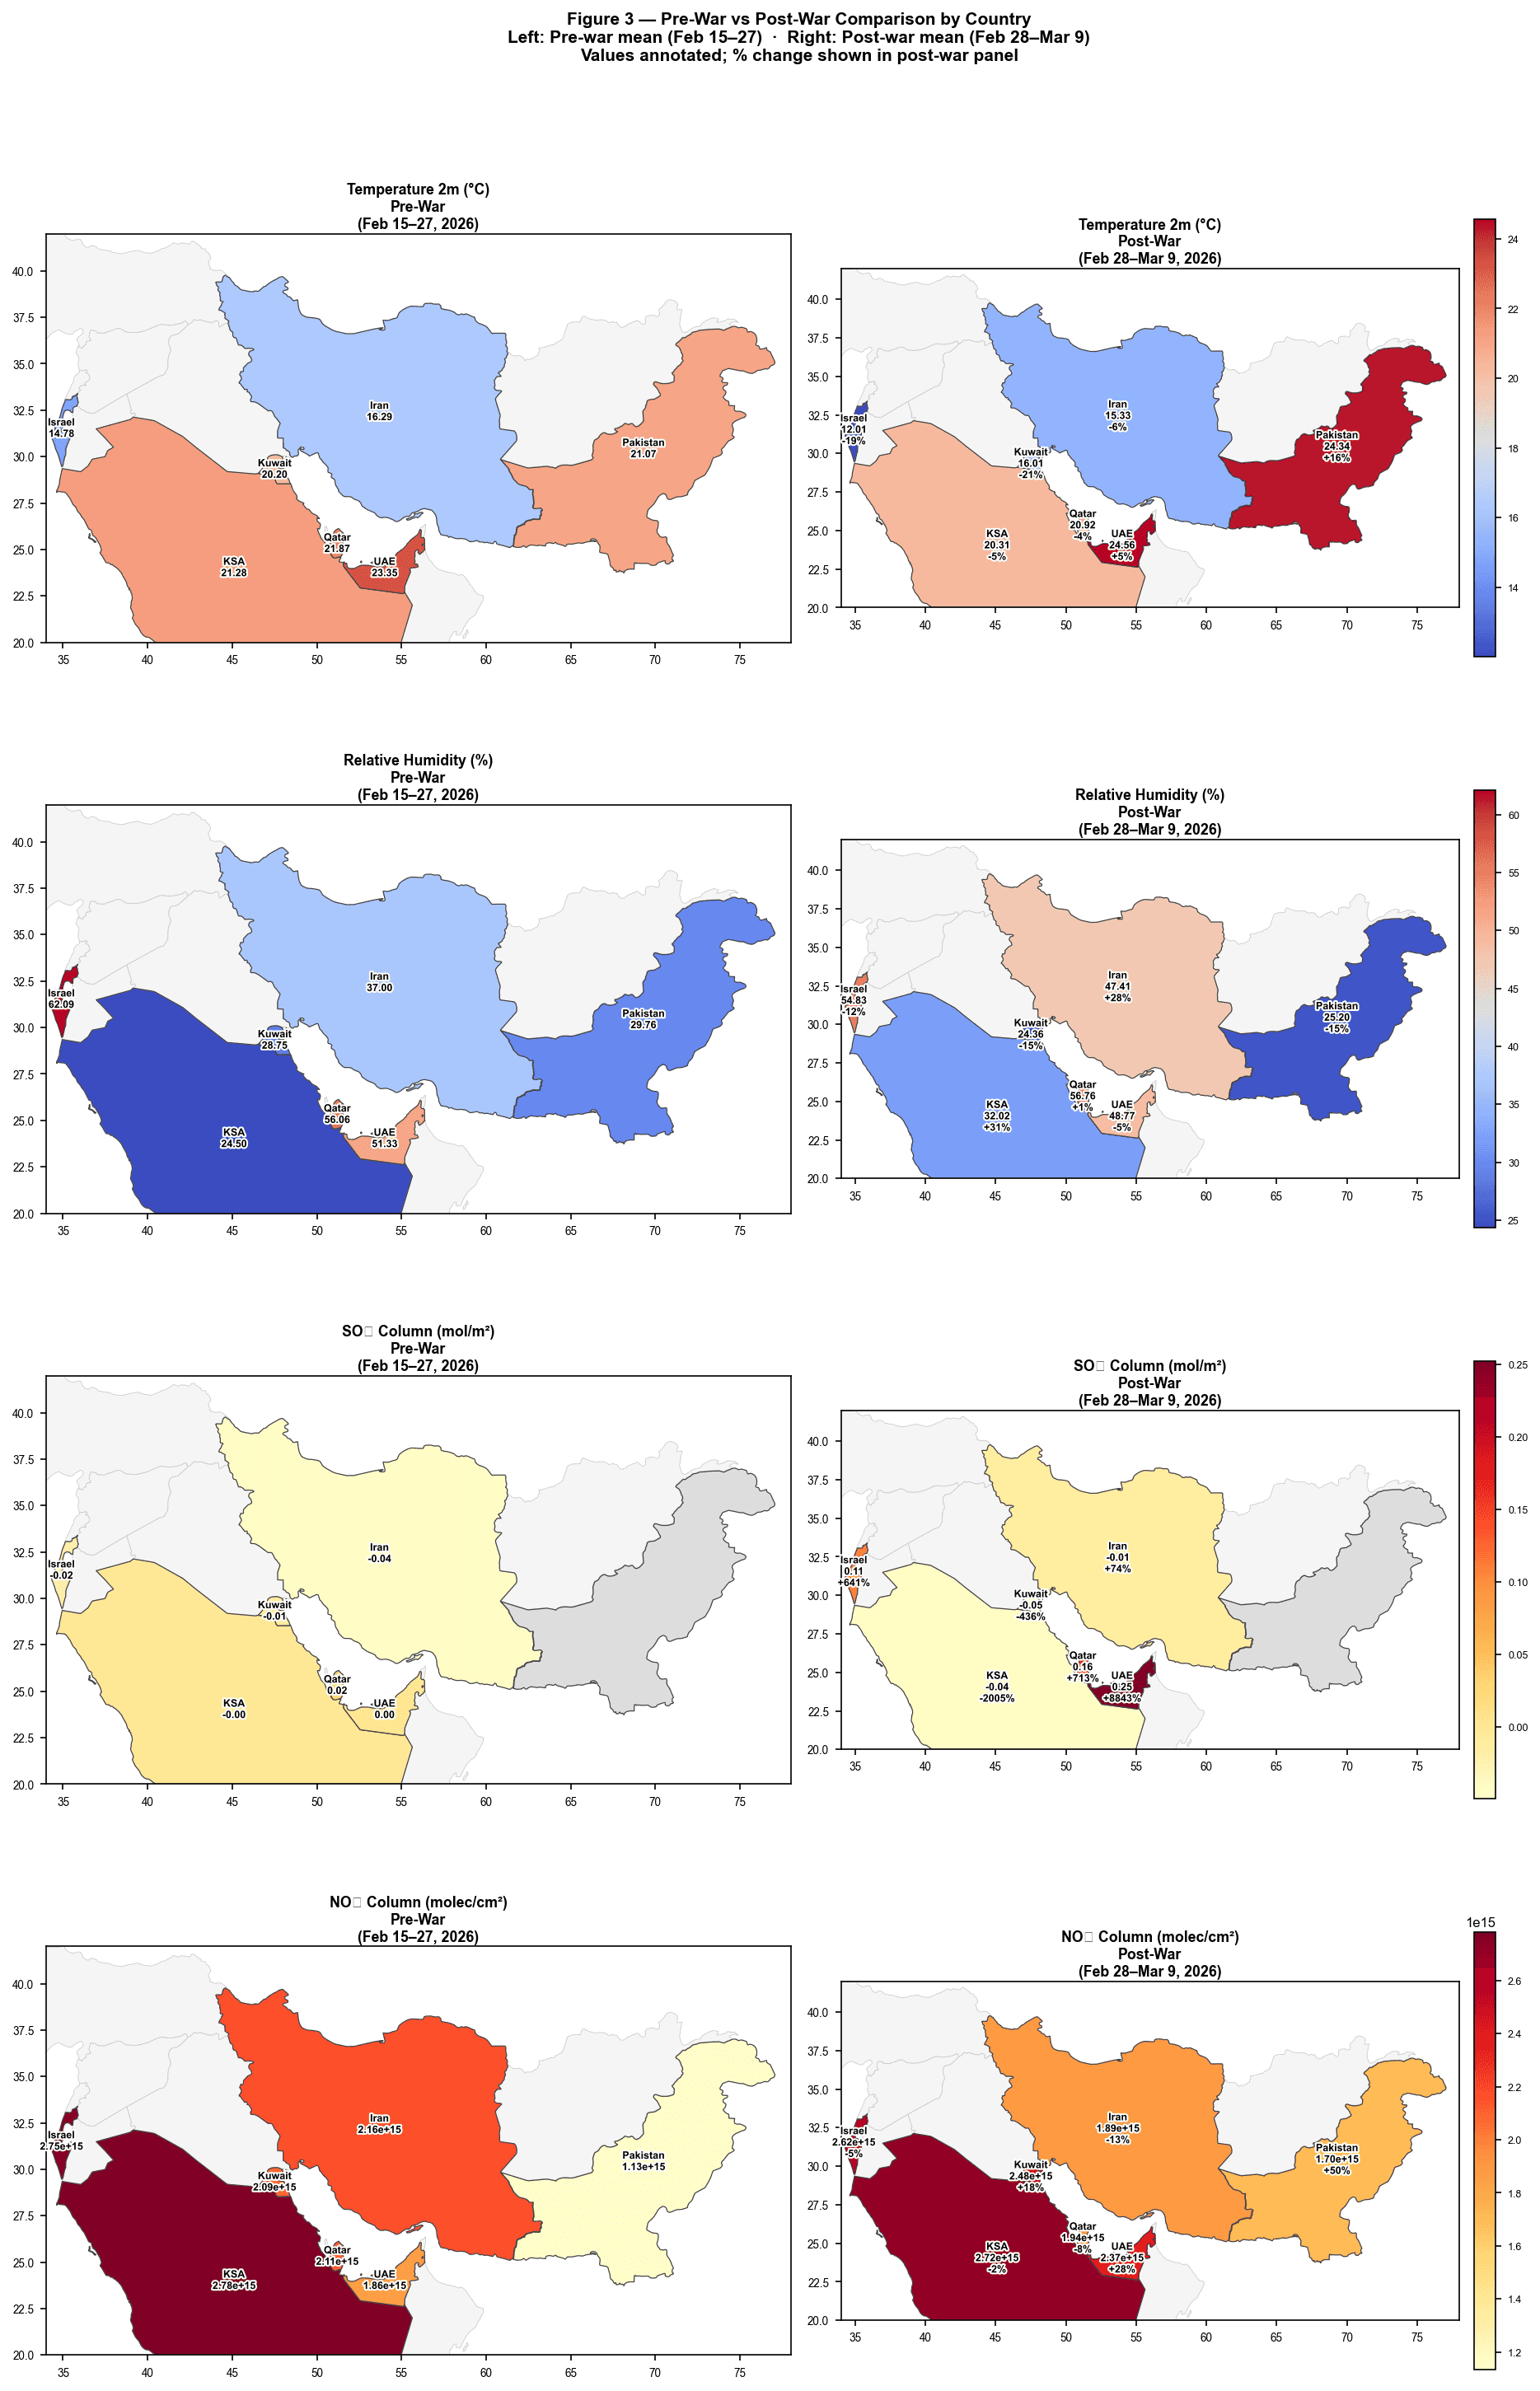
Israel returned the most widespread statistically robust signal: mean temperature fell −18.75 % (p = 0.004, Cohen's d = −1.47), precipitation dropped −92.7 % (p = 0.010), and relative humidity declined −11.7 % (p < 0.001). Kuwait recorded near-zero p-values across all three temperature metrics — mean temperature down −20.8 % with a Cohen's d of −3.53, one of the largest effect sizes in the dataset.
Pakistan — the designated control — registered significant increases in CO (+10.6 %, p < 0.001), NO₂ (+50 %, p = 0.004), ozone (+18.8 %, p = 0.019), and surface temperature (+15.5 %, p < 0.001), suggesting regional atmospheric circulation was carrying combustion byproducts eastward even in the absence of direct strikes.